Data Insights and Actionable
Overview
In this section we will take a look at what Fynd will do as consultants and how we will help the business grow and reach their desired goals.
Data Insights for Business Growth
Here Fynd will analyse the business data and provide feedback to the brand based on the findings on what has gone well for them in the previous year, quarter and MoM basis.
This analysis will help in making informed decisions, knowing what limitations are being faced by the brand and what can be done to mediate them.
Cut Size Analysis
If a size of a top-selling SKU is out of stock (OOS) then it will not be visible to the customer when they visit the PDP. The SKU x size that falls under this is called cut size. We analyze the Brands to check the SKUs that are cut sizes and how to avoid that.
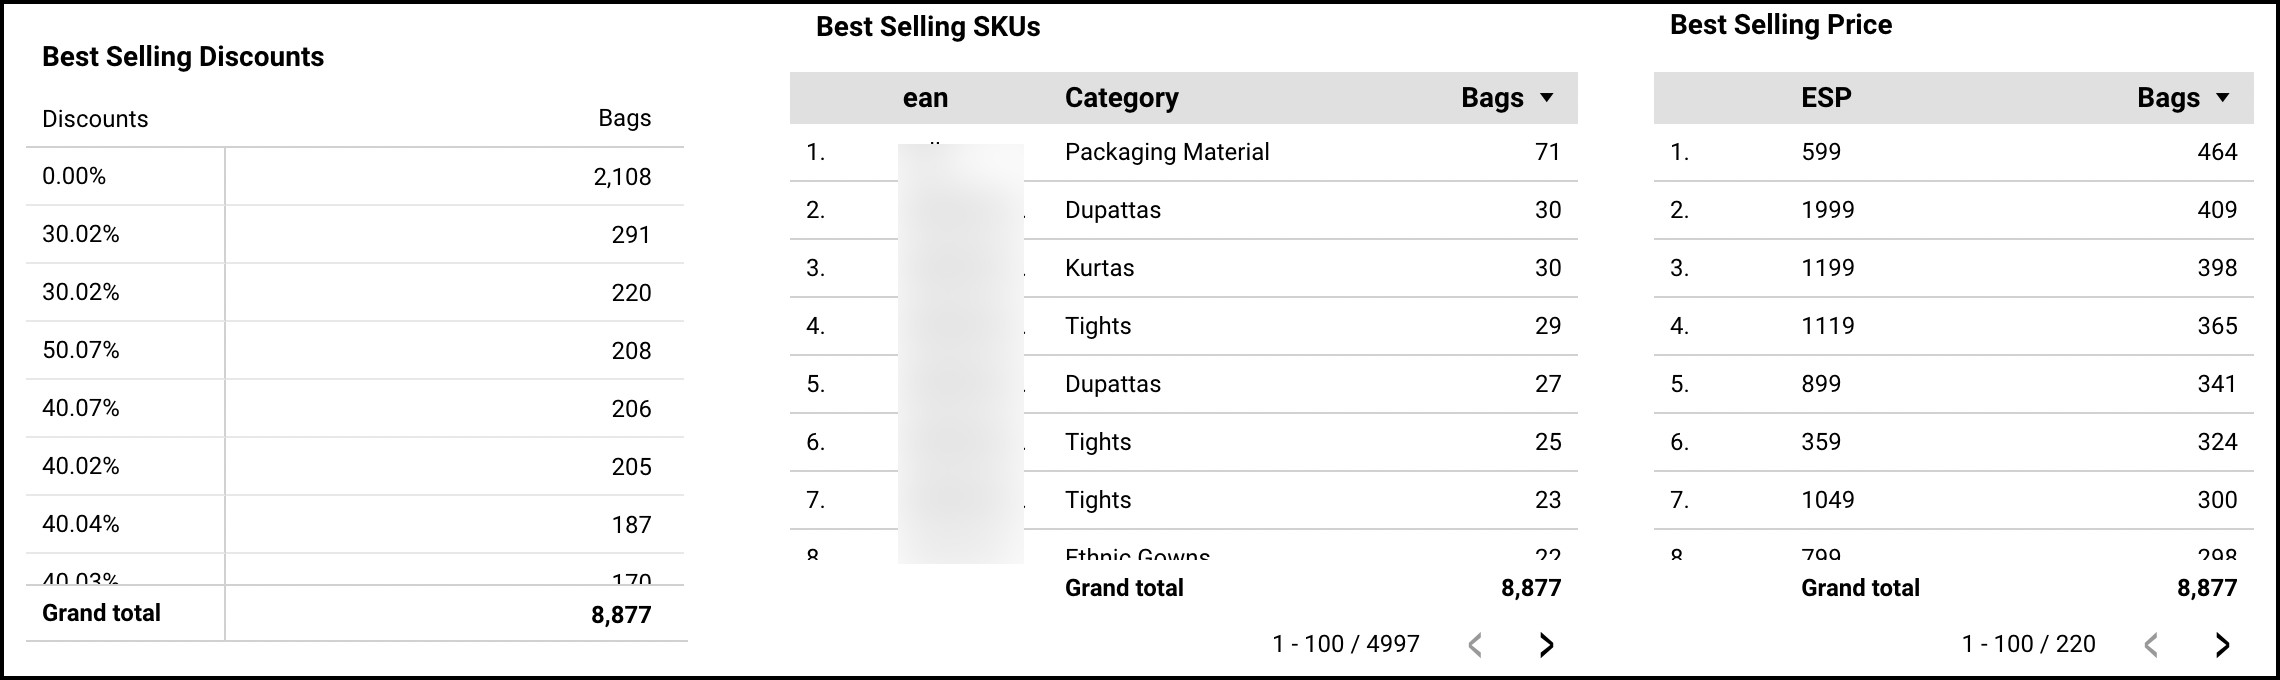
Let’s see the dashboard data for a brand wrt the best-selling SKUs From the dashboard data, we can check the SKUs that are sold the most across marketplaces and we can also check the product size of those SKUs.
By analysing that data we can come up with strategies to keep the inventory updated so that the most selling SKU sizes are never OOS. From the dashboard, we will be able to determine the best-selling SKUs, discounts and selling prices. Here is a sample of the dashboard for the above
We have an extension on our Fynd Platform that will send you alerts regarding low stock and OOS reports. You will receive inventory data on the product level or item level. Using this extension, you can keep track of and restock the inventory for your most selling/top-selling products to avoid cut sizes. OOS Product Reports
Consider the following example where we performed the SKU level and cut size analysis for a brand by comparing their listings on Omni and other marketplaces :
SKU level Analysis
| Flipkart | Myntra | Actionable | |
|---|---|---|---|
| Total EANs/FSNs listed on JIT + Non JIT | 3252 | 2627 | Get all SKUs listed on Myntra. |
| Total EANs/FSNs listed on Omni | 2710 | 2190 | Get all SKUs migrated on Omni. |
| Total EANs/FSNs listed on Fynd | 2388 | 1855 | Get all SKUs listed on Fynd. |
| Total EANs/FSNs Mapped | 1600 | 1389 | Get all SKUs mapped on Fynd. |
Cut Size Analysis
| Flipkart | Myntra | Actionable | |
|---|---|---|---|
| Total Styles listed on JIT + Non JIT. | 1007 | 815 | Get all Cut Sizes Listed. |
| Total Styles listed on JIT + Non JIT with cut sizes. | 969 | 811 | |
| Total Styles listed on Omni. | 877 | 694 | Get all Cut Sizes Listed. |
| Total Styles listed on Omni with cut sizes. | 870 | 563 | |
| Total Styles listed on Fynd. | 714 | 560 | Get all Cut Sizes Listed. |
| Total Styles listed on Fynd with cut sizes. | 9 | 9 |
Priority Actionable:
Based on the analysis, we conclude that we need to get all the JIT SKUs listed on our Omni marketplace and on the Fynd Platform for the styles that are already listed, we need to list the SKUs on our JIT model to avoid cut sizes.
Of all the styles listed on the marketplaces, 95% are cut sizes. It will affect the click-to-view and click-to-purchase conversion rates as the products will seem unavailable on the PDP.
Consider the following example: If there is a top-selling product x SKU like Kurta or T-Shirt in M, L and XL sizes. The inventory for these has to be more compared to other sizes of the same style to prevent cut sizes. Fynd will have a detailed discussion on the replenishment process for them and also set up alerts to indicate when the inventory is low for these top-selling products to ensure it doesn’t become OOS.
To avoid loss of sales due to customers not being aware of the products, Fynd will help the seller with marketing campaigns to increase the visibility of these top-selling products. There would be certain products that sell more during a specific season. For example, hoodies or sweatshirt sales are higher during the winter season. It can be capitalised by running promotions on said products to maximize sales. Offering a 10%-15% discount or a free item on purchase of 3 or more products will help drive sales.
Performance Analysis
We will conduct a Performance Analysis for the Brand and share the results with them. Let’s consider the example where we analysed a brand’s performance in a marketplace on the following parameters:
Insights
We checked the cut sizes that must be removed from marketing campaigns.
Checking why the added to cart items are not selling.
Analysing how many styles became cut sizes in the last 30 days.
Comparing the top selling items of Dec’ 21 with top selling products of Jan’ 21
Findings
Based on the findings, we will discuss ways in which we can increase the brand’s future sales revenue. Details like high add to cart vs low purchase will be directly discussed with the marketplace category teams to get the reasoning behind it.
Here are some of the overall PLA stats
.png)
Here we can check the total number of clicks for the brand and the revenue generated. This is something we can do for the brand if they request for it.
.png)
Above is the summary of the display ads overall. We can share this data with the brand for performance evaluation. We can calculate the details over 30-day periods for MoM evaluations.
This performance analysis will help the brand with evaluating its business decisions and come up with strategies to improve upon the sales from the previous year.
Historical Sales Analysis
When the brand goes live on a marketplace, it may not have the same SKUs that are live on other marketplaces or it might not have all the SKUs listed. It may have some stores that are active for a while and some stores that are active at all times.
To get a detailed idea regarding which are the best-selling SKUs, wrt size, colour, location etc; Fynd will conduct an analysis for the brand.
For this analysis, there needs to be at least one sales quarter's worth of data available. After the brand has been live for 3-4 months, we can perform the data analysis that will help plan the future actionable.
Consider the following example: An apparel brand has been experiencing a drop in sales. We performed an analysis of the sales figures from July 21- Oct 21. A large portion of the brand’s sales revenue was from Myntra so we focused on that marketplace for this case.
Findings
Between the months of July - Oct, there was a 61% drop in the sales and 43% drop in the amount of bags sold.
.png)
.png)
The findings showed that there were 16 stores live in July which later dropped to 10, of the ones that were live on July, 6 of them contributed almost 94% in sales.
.png)
In October, there were 16 active stores for the first 3 days then only 2 for the rest of the month. Of the 6 stores that contributed to most of the sales in July, only 1 was live for most of October resulting in 21% of the sales. The average discount percentage increased while the MRP decreased in October. This resulted in lower sales for that month.
Insights
The discount percentage was lower and the MRP was higher in July and still the brand had higher sales which implies that the discount wasn’t the primary reason for reduced sales in October
.png)
October is the month when winter apparel is sold more than in July. The top 25 selling products in July had sales of about 12 lacs whereas, for October it was 17 lacs. It shows that in July, the sales were more distributed among products whereas, in October, certain products sold more but the total live SKUs were less.
Suggestions
Ensure that the top-selling locations are always active and that the inventory present in these stores is maintained across other stores. We checked the top 5 states where the customers belong and there must be at least 1 active store in each of those states.
.png)
There are 4-5 products that have very high sales in both months so the inventory for these SKUs must be increased to avoid the OOS scenario.